Learn PWM signal using Wokwi Logic Analyzer
Experience PWM duty cycle and frequency in a visual way and level up your signal analysis skills

Introduction
PWM is a fundamental feature of any microcontroller (MCU). Popular use cases of PWM are to control motor speed or vary the brightness of an LED.
In this article, we will learn about PWM signals. We’ll run several programs implementing PWM in the application. We’ll see how we can easily monitor the PWM features, such as frequency and duty cycle, using the logic analyzer.
We’ll learn how to add a logic analyzer on Wokwi, make connections, and log and view the PWM data. Logic analyzer helps you view the voltage status on pins, measure pulse widths, observe timings between two events, and more!
Let's capture! 🔭
Basics of a PWM signal
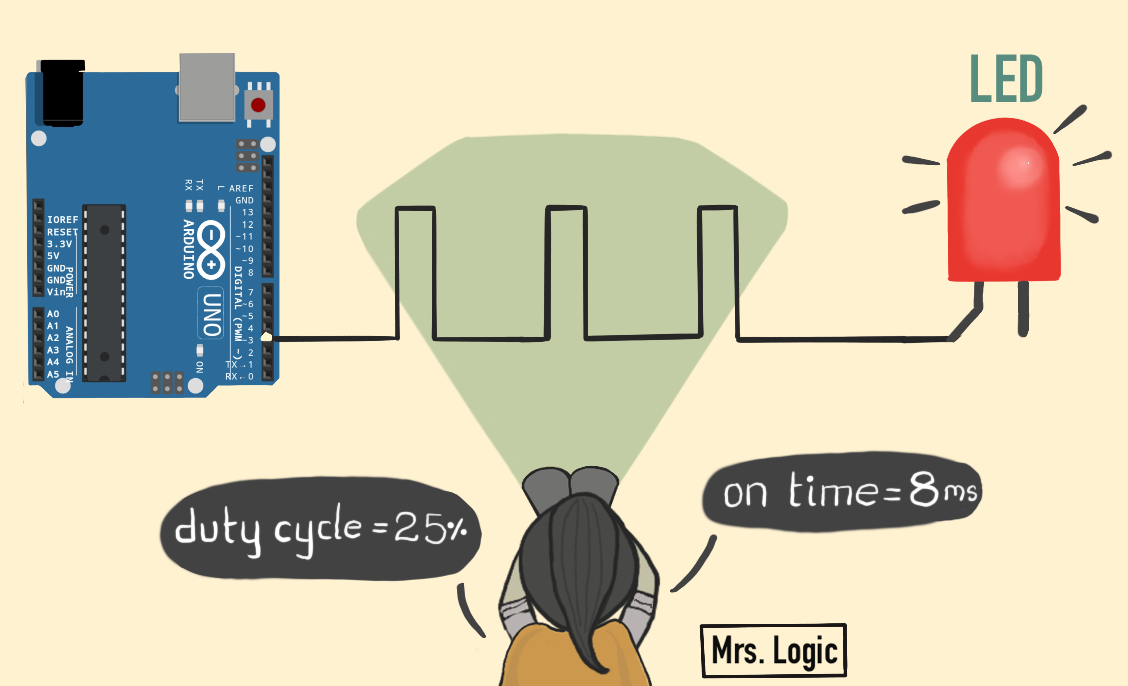
PWM stands for Pulse Width Modulation. It's a way to control the amount of power going to an electronic device by turning it on and off very quickly. Imagine you have a light bulb that you want to control how bright it is. Like a blink, you can toggle the power on and off really fast.
Source: https://wokwi.com/projects/323945277471851092
PWM is used in many electronic devices like fans, LEDs, and motors to control how fast or how bright they are. It's also used in things like dimmer switches for lights and speed controllers for electric vehicles. It's a handy technique to control the power and efficiency of different devices with a simple circuit.
What is a duty cycle of a PWM signal?
The amount of time the power is on compared to the amount of time it's off is called the "duty cycle."
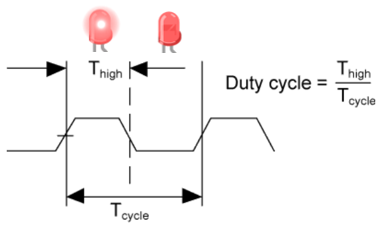
To calculate the duty cycle, measure the signal's pulse width when it’s in the “high” state, and the signal's total period. Then, divide the “high” pulse width by the period(Tcycle) of the signal. The image below is a graphical illustration of the duty cycle.
So if the power is on for half the time and off for half the time, the duty cycle is 50%. If the PWM signal is on for 80% of the time and off for 20% of the time, the duty cycle is 80%.
By varying the duty cycle, you can increase or decrease the total power delivered to the load in small steps.
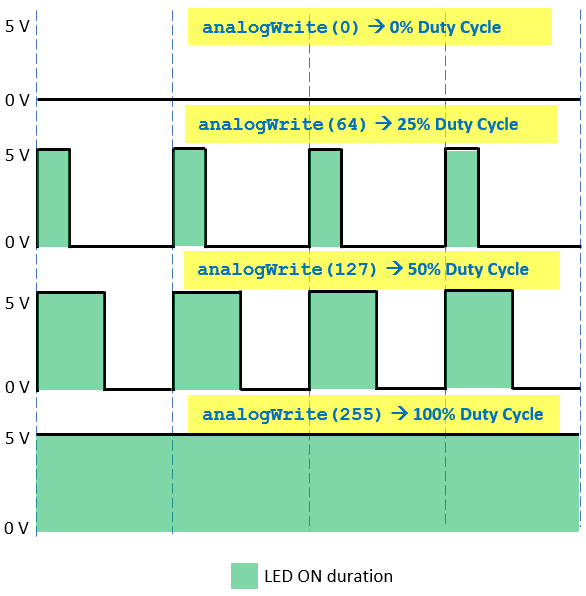
The image below shows a signal with four different duty cycle settings.
How to calculate the frequency of a PWM signal?
Frequency, measured in Hertz (Hz), is the number of repeating events per unit time. For example, if an LED turns on and off 10 times per second, its frequency is 10 Hz.
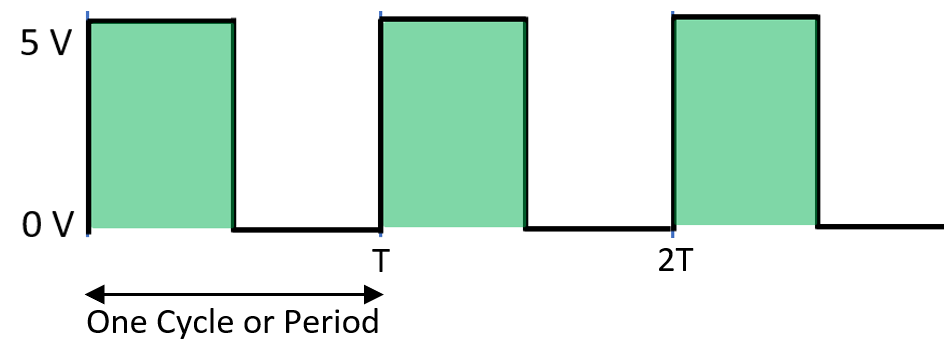
For a cyclic signal, such as an SPI Clock, the signal's frequency is 1/T, where T is the one-cycle period.
Which pins are PWM compatible?
Most of the MCUs will have PWM-compatible pins. For example, the Arduino UNO has several pins capable of producing Pulse Width Modulation (PWM) signals. These digital pins are marked with the tilde (~) symbol next to them on the board. Note that these are hardware PWM pins.
On the Arduino UNO, the following pins are PWM compatible: 3, 5, 6, 9, 10, and 11.
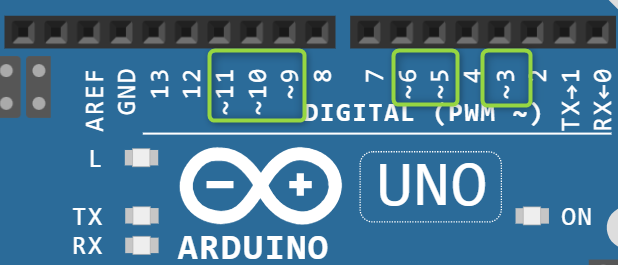
These pins are on the digital side of the Arduino UNO, and can be used for PWM output using the analogWrite() function in the Arduino programming language.
You can create PWM on any pin using software and timer interrupts. Pretty cool, right?
The analogWrite() function takes two arguments:
- the first is the pin number that you want to generate the PWM signal on, and
- the second is the duty cycle of the signal, which should be an integer value between
0and255.
analogWrite(PIN, VALUE);For example, if you want to generate a PWM signal with a 50% duty cycle on pin 3, you can use the following line of code:
analogWrite(3, 128);This will cause pin 3 to switch on and off rapidly, and during 50% of the time pin 3 will be high, and during the other 50% it will be low. The VALUE sets the duty cycle, which controls the signal's on/off time ratio.
| VALUE | Duty Cycle |
|---|---|
| 0 | 0% |
| 127 | 50% |
| 255 | 100% |
analogWrite(). You have to use hardware timers. However, be aware that modifying the timer settings may cause certain Arduino functions to cease working properly.💀
It's also important to note that Not all the PWM pins are created equal; They may have different maximum frequencies and/or resolution. For example, in Arduino UNO, you can find 6 PWM pins with the following properties.
| PWM Pins | Frequency | Timer ID |
|---|---|---|
| Pin 5 and 6 | 980 Hz | Timer 0 |
| Pin 9 and 10 | 490 Hz | Timer 1 |
| Pin 3 and 11 | 490 Hz | Timer 2 |
Monitoring the PWM Signal
Let us now put on our "Geek glasses" and start monitoring PWM signals on Wokwi. Follow this link to learn the basics of setting up a Wokwi logic analyzer and viewing signals.
You can use the prebuilt project, which fades the LED connected to pin 5 of the Arduino UNO. Run the simulation for 3-5 seconds, then stop the simulation. Notice that the logic analyzer displays the number of samples recorded.
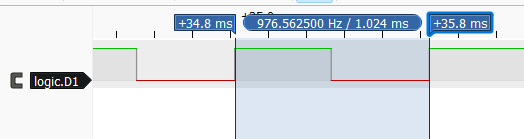
Once you stop the simulation, save the log file. Open it in the PulseView application. The data line transitions similar to the image below will appear.
You can further zoom in on the data region to see the signal in more detail. The measured frequency is 976.5 Hz.
In the next step, we will add the protocol analyzer to read the PWM duty cycle and frequency.
Adding the PWM Protocol Analyzer
- Click the “Add protocol decoder” button at the top. This is the yellow and green icon. The “Decoder Selector” pane will slide into the right-hand side of the screen.
- Type PWM on the Decoder Selector’s search bar. Then, double-click PWM from the search results.
- A PWM row will be added below the
logic.D1row.
You can click on the protocol analyzer PWM label (green color button in the image below) to view and edit the PWM information and select the Data line.
Hooray! You can now observe the duty cycle and the signal period easily!
Changing the duty cycle of the PWM signal
Let’s vary the duty cycle and observe the waveforms on the logic analyzer.
Case 1: 25% Duty Cycle
To create a 25% duty cycle, the analogWrite() function should have a VALUE of 64.
analogWrite(5, 64);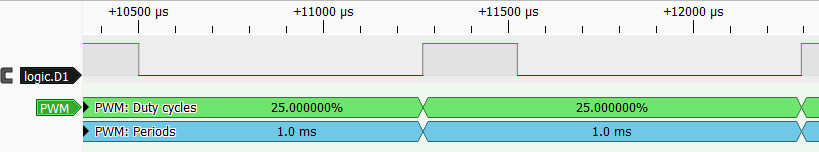
Check it out! The PWM duty cycle is showing up on the analyzer and it's looking good. It's showing 25%, which is precisely what we set in the code. All good there!
64 come from? How was it determined that 64 should be used to achieve a 25% duty cycle?To arrive at a
25% duty cycle, the calculation is: (25 * 255) / 100 = 63.75. Since the VALUE parameter of analogWrite() can only be an integer, I have used the nearest integer value, 64.In the next section, we’ll change the duty cycle to 75%.
Case 2: 75% Duty Cycle
To create a duty cycle of 75%, change the VALUE to 191 and rerun the simulation.
analogWrite(5, 191);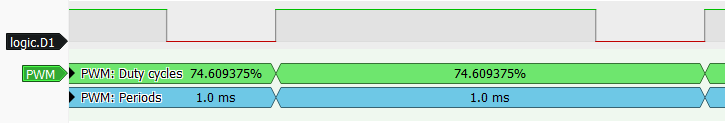
Great! We now created a PWM signal with a 75% duty cycle. In the next section, we will monitor both PWM Pins 5 and 3 of the Arduino UNO.
0% duty cycle in PWM means the signal is always off, like turning off a motor or LED permanently. A 100% duty cycle means the signal is always on, delivering maximum power to the load. PWM can also be used to control ON/OFF devices by setting the duty cycle to
0% or 100%.Monitor two PWM signals
Let’s also connect Arduino UNO’s pin 3 to the logic analyzer. Click the link below to quickly access the project.
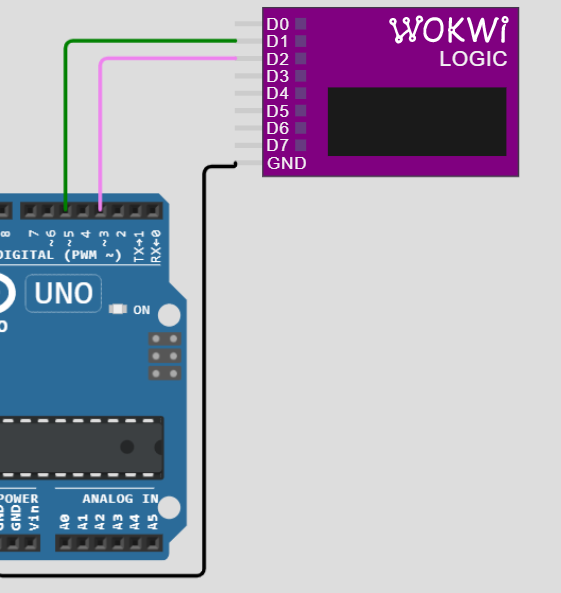
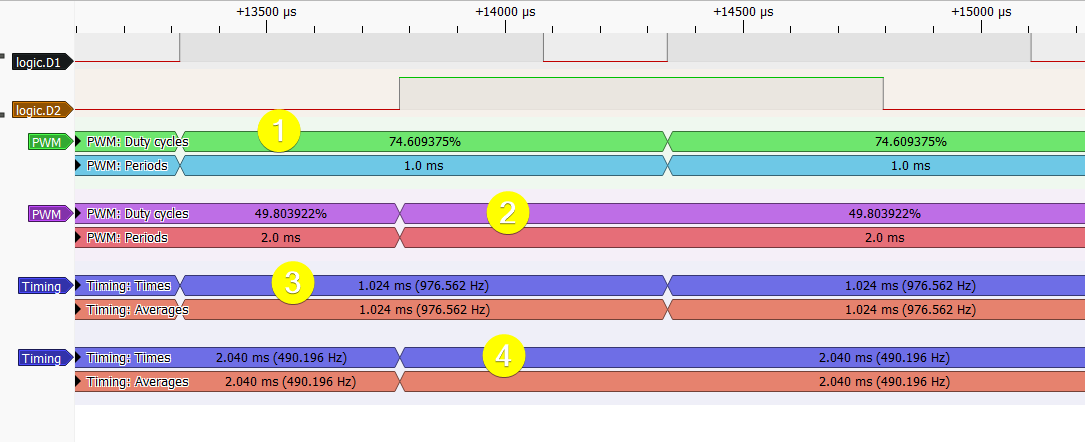
Rerun the simulation, then add one more PWM protocol analyzer to the logic data line D2. Below is a screenshot of the signal from the PulseView application. We can observe both PWM signals and the timings on those pins.
Observations
- PWM duty cycle of
~75%for PWM pin5. - PWM duty cycle of
~50%for PWM pin3. - The frequency of the signal on Pin
5is976 Hz. - The frequency of the signal on Pin
3is490 Hz.
When the PWM frequency is high, the signal's rise and fall time can affect the accuracy of the signal, especially when the duty cycle is close to
0% or 100%.Rise time - The amount of time it takes for a signal to transition from a low to a high voltage level.
Fall time - The amount of time it takes for a signal to transition from a high to a low voltage level.
Note: In piezoelectric speakers, you can control the audio output using a fixed duty cycle with variable frequency PWM. The duty cycle controls the amplitude or volume of the audio output, while the frequency controls the pitch or tone.
Conclusion
This article provided an in-depth look at PWM signals. We observed how to use the Wokwi simulator to monitor and analyze these signals on a logic analyzer. I believe that you have gained a deeper understanding and newfound appreciation for PWM and its capabilities. With this understanding, you can efficiently utilize a logic analyzer to build and troubleshoot PWM projects.
If you have any feedback or suggestions to enhance the simulator and make it more beneficial, you can always reach out to us and connect via Facebook, Discord, and Twitter.