Arduino/AVR GDB Cheat Sheet
List of common GDB commands for debugging AVR code.

Program Execution
| Command | Short form | Description |
|---|---|---|
| continue | c | Run the program |
| advance setup | adv setup | Run the program and stop at the beginning of setup() * |
| next | n | Execute the next line of code (step over) |
| step | s | Step into the next line of code |
| finish | fin | Run the program until the current function returns (step out) |
| nexti | n | Execute the next instruction (step over) |
| stepi | si | Step into next instruction |
| until | u | Like next, but doesn't go back in loops |
| Ctrl+C | Break the program at the current instruction |
* The advance command will also stop if the current function returns
Breakpoints
| Command | Short form | Description |
|---|---|---|
| info breakpoints | i b | Display a list of all the breakpoints |
| break loop | b loop | Set a breakpoint at the beginning of loop() |
| break 42 | b 42 | Set a breakpoint in line 42 |
| break *0x156 | b *0x156 | Set a breakpoint at program address 0x156 |
| tbreak loop | tb loop | Set a one-time (temporary) breakpoint in loop() |
| clear loop | cl loop | Delete any breakpoints on loop() |
| clear 42 | cl 42 | Delete any breakpoints on line 42 |
| delete 1 | d 1 | Delete breakpoint number 1 |
| disable | dis | Disable all breakpoints |
| disable 1 | dis 1 | Disable breakpoint number 1 |
| enable | en | Enable all breakpoints |
| enable 1 | en 1 | Enable breakpoint number 1 |
| enable once 1 | en once 1 | Enable breakpoint number 1 for a single hit |
Call Stack
| Command | Short form | Description |
|---|---|---|
| backtrace | bt | Display a backtrace of the current call stack |
| backtrace -full | bt -fu | Display backtrace including local variables |
| info args | i ar | Dump the arguments of the current function |
| info locals | i lo | Dump local variables and their values |
| info registers | i r | Dump MCU registers |
| faas info args | fa i ar | Dump the arguments of all functions in the call stack |
| frame 2 | f 2 | Select frame number 2 |
| up | Go one stack frame up (e.g. calling function) | |
| down | do | Go one stack frame down |
Inspecting Code
| Command | Short form | Description |
|---|---|---|
| list loop | l loop | Show the source code of loop() |
| disassemble | disas | Disassemble the current program location |
| disassemble/s | disas/s | Disassemble including source code |
| disassemble/r | disas/r | Disassemble including opcodes (in hex) |
| disassemble loop | disas loop | Disassemble the loop() function |
Inspecting Data
| Command | Short form | Description |
|---|---|---|
| print $pc | p $pc | Print the value of PC (Program Counter) |
| print $r0 | p $r0 | Print the value of the R0 register |
| print i | p i | Print the value of the variable i |
| print PORTB | p PORTB | Print the value of the I/O register PORTB |
| dprint loop,"Loop\n" | dp … | Print "Loop" every time loop() starts |
| dprint loop,"%d\n",i | dp … | Print the value of i every time loop() starts |
| x/16b $sp | Dump 16 memory bytes starting at $sp (stack pointer) | |
| x/10w 0x800200 | Dump 10 dwords starting at data space address 0x200 | |
| x/s 0x800151 | Dump a string from the data space address 0x151 | |
| display someVar | disp someVar | Display the value of someVar whenever the program stops |
| info display | i di | List active auto-display (watch) expressions |
| delete display 1 | d d 1 | Delete auto-display expression number 1 |
Modifying Data
| Command | Short form | Description |
|---|---|---|
| set i = 0 | s i=0 | Change the value of variable i to 0 |
| set $pc = 0 | s $pc=0 | Jump to the beginning of the program |
| set $r12 = 0x55 | s $r12=0x55 | Set r12 to 0x55 |
| set PORTB = 0xff | s PORTB=0xff | Set PORTB (I/O register) to 0xff |
| set {int}0x800200 = 50 | s … | Set an integer at dataspace address 0x200 to 50 |
Text User Interface (TUI)
| Command | Short form | Description |
|---|---|---|
| tui enable | tu e | Enable the TUI mode (also Ctrl X+A) |
| tui disable | tu d | Disable the TUI mode (also Ctrl X+A) |
| tui reg all | tu r a | Display registers window |
| layout asm | la a | Switch to Assembly view |
| layout src | la sr | Switch to Source Code view |
| layout split | la sp | Switch to Split (Assembly + Source Code) view |
| update | upd | Show the current line in the Source Code window |
| Ctrl+L | Redraw the screen |
Other commands
| Command | Short form | Description |
|---|---|---|
| (empty line) | Repeat the previous command | |
| help continue | h c | Show help about the "continue" command |
| help break | h b | Show help about the "break" command |
| help breakpoints | h breakpoints | Display a list of all breakpoint-related commands |
| quit | q | Exit GDB (in Wokwi Web GDB, GDB will restart) |
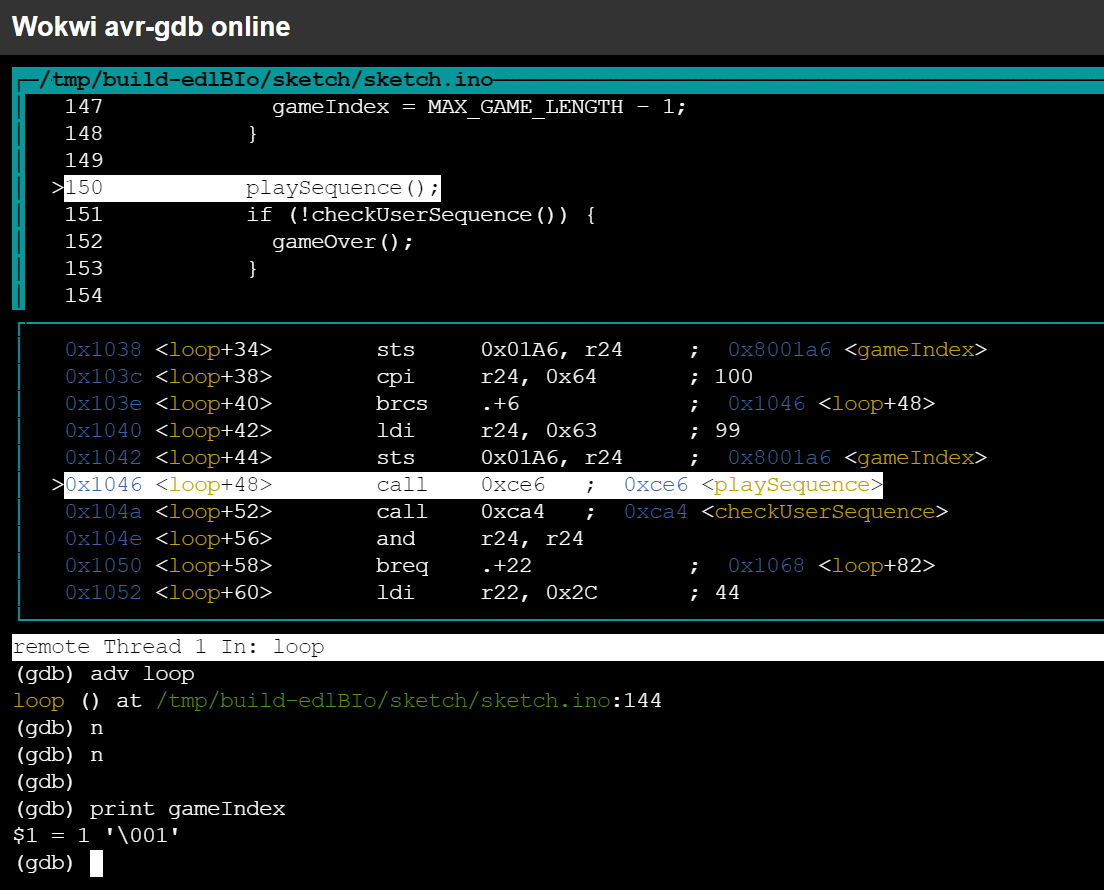
Using GDB with the Wokwi Simulator
You can use the Wokwi simulator to play around with GDB and debug your Arduino code.
To start a GDB session, open any project on Wokwi (e.g. this Simon game), click on the code editor, and press F1. In the prompt that opens, type "GDB":
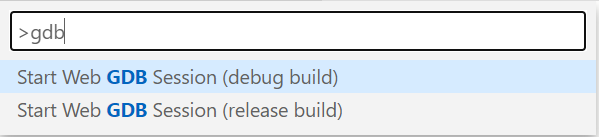
Then choose one of the options to launch GDB in a new browser tab. In general, the "debug build" is recommended for optimal debugging experience, but some libraries (e.g. FastLED) may not function correctly without the compiler optimizations.
I suggest to start with the "debug build", and switch to the "release build" only if the program doesn't work correctly.
The Web GDB app takes about 30 seconds to start for the first time, and should load within a few seconds after the first time.
When GDB is ready, it should print something like:
0x00000000 in __vectors ()
(gdb)
At this point, you can write continue to start running the program, advance setup to run the program and stop at the beginning of the setup() function, or any other command from the GDB cheat sheet above.
P.S. if you are curious, here's how I got GDB to run in the browser.